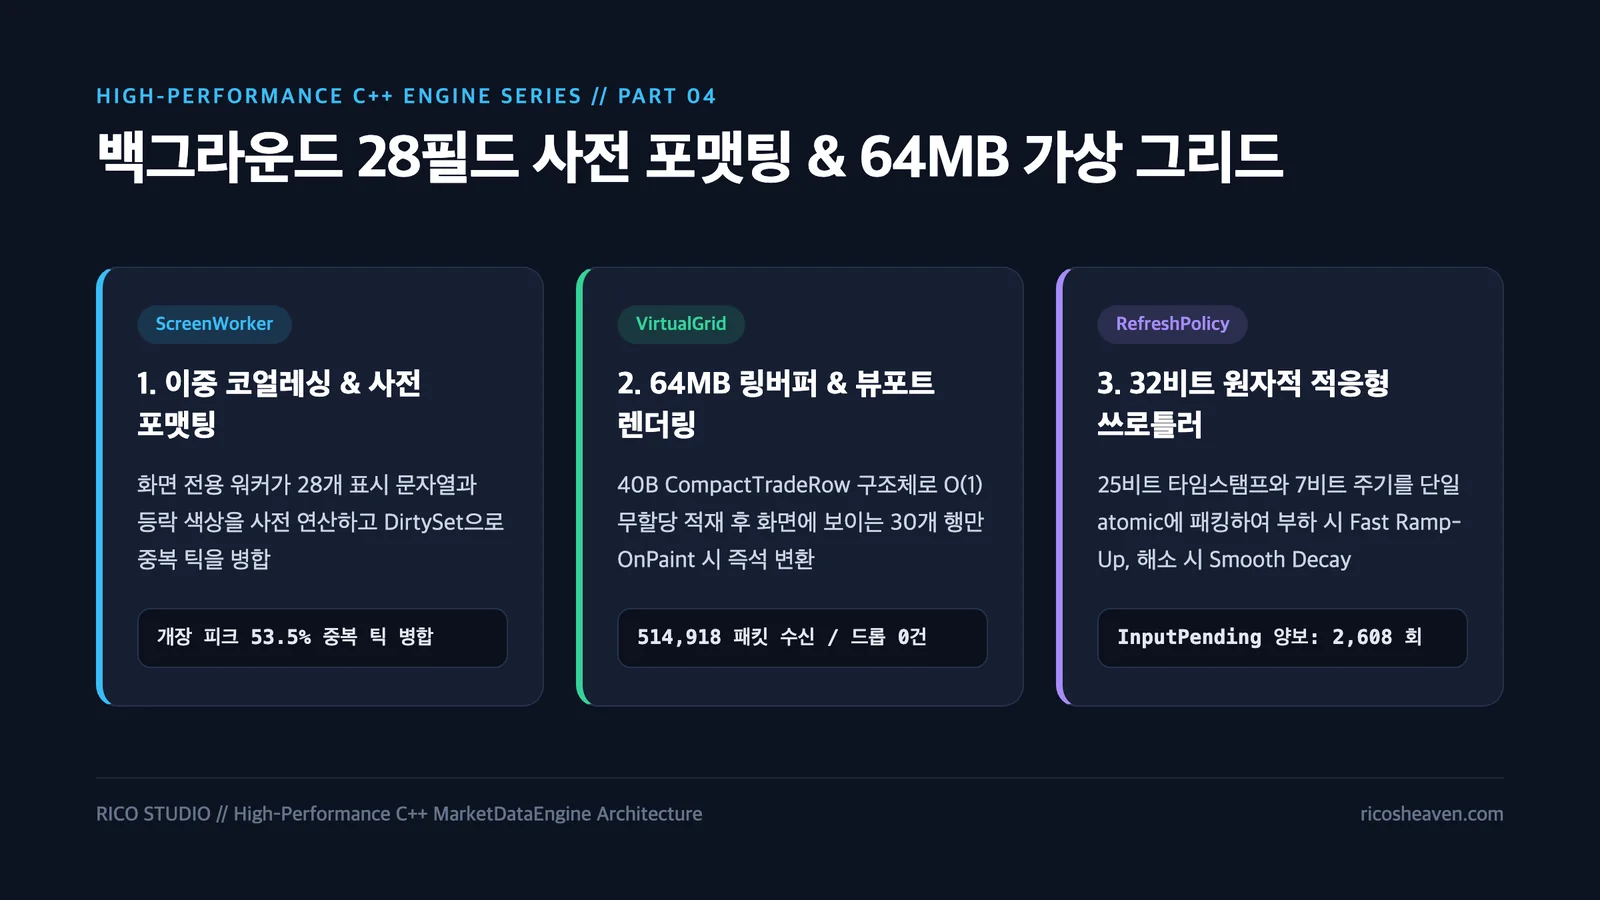
Introduction: Fast Snapshots Mean Nothing If the Grid Is Still Slow
Through [Part 2] and [Part 3], background packet parsing and lock-free RCU snapshot synthesis (SymbolSnapshot) accelerated to the microsecond ($\mu s$) level.
Yet when we profiled how UI views actually consumed those snapshots, we still observed two massive workloads choking the main UI thread:
- String Formatting Bottleneck in the Watchlist Grid (
WatchlistView):
In a grid displaying 200 symbols, converting last price, net change, percentage change (+3.45%), volume (12,345,678), turnover, and quotes into comma-formatted strings (sprintf/Format) and computing RGB tick colors every 100ms was still running inside the UI thread'sOnTimerhandler. - Row Insertion Bottleneck in the Full-Market Time & Sales Stream (
TimeAndSalesView):
Every time a trade occurred anywhere in the market (thousands of symbols), inserting a new row at index 0 (InsertRow(0)) and shifting tens of thousands of cell string allocations triggered $O(N)$ memory moves and severe heap fragmentation.
In [Part 4], we introduce our dedicated background ScreenWorker, our 64MB Ring-Buffer VirtualGrid, and our lock-free adaptive frame throttler (RefreshPolicy) that eliminated both bottlenecks from the UI thread.
1. Dedicated ScreenWorker & Background Pre-Formatting of 28 Display Fields
What if the exact representations a watchlist grid needs right before painting—"comma-formatted strings + sign glyphs (▲/▼) + RGB text colors"—were already pre-computed on a background thread?
We assigned each heavy grid screen its own background context (ScreenContext) and combined two key techniques:
flowchart LR
    subgraph Shard["Shard Worker"]
        A["SymbolSnapshot Updated"] --> B["Dispatch ScreenTask to Subscribed Views"]
    end
    subgraph Screen["ScreenWorker (Background)"]
        B --> C["Per-Symbol Task Conflation"]
        C --> D["Pre-Format 28 Display Strings & Compute Tick Colors"]
        D --> E["Publish PreformattedScreenSnap & Insert Symbol into DirtySet"]
    end
    subgraph UI["Main UI Thread (OnTimer)"]
        E -->|"PopDirtyCodes()"| F["O(1) Lookup of Dirty Symbols & Direct String Pointer Assignment"]
    end
① Double Coalescing (Queue-Level & Dirty-Set Level)
Suppose 30 trade packets arrive for Samsung Electronics (005930) within a 50ms window at the market open:
- If a task for
005930is already waiting in theScreenWorkerqueue, the worker simply swaps its snapshot pointer to the newest version rather than enqueuing duplicate work (Task Conflation). - Even if the
ScreenWorkerwakes up 3 times during that 50ms window and formats the snapshot, thedirtyCodesset (unordered_set+vector) consumed by the UI records"005930"only once (Dirty Coalescing). - In our 9-minute market open benchmark, 53.5% of all tasks entering
ScreenWorkerwere merged at the dirty coalescing stage, cutting UI grid updates by more than half.
② Zero-Allocation Pre-Formatting of 28 Display Fields
ScreenWorker formats raw numeric fields into fixed-size character arrays inside PreformattedScreenSnap (e.g., char formattedPrice[24], char formattedRate[16]). As a result, the main UI thread's OnTimer performs zero CString::Format calls or floating-point divisions—it simply copies pre-built string buffers directly into grid cells.
2. Sustaining Thousands of Trades/sec: The 64MB VirtualGrid & StreamStore
A full-market real-time Time & Sales screen (TimeAndSalesView) behaves very differently from a watchlist. Instead of showing only the latest state per symbol, it must accumulate up to 100,000 chronological trade events in history and allow instant scrolling.
Previously, the legacy grid handled every arriving trade by:
- Dynamically allocating a physical
Rowobject inside the grid control, and - Formatting 12 column strings and copying them into cell heap memory.
At 100,000 rows, 1.2 million cell objects were allocated on the heap, causing memory usage to balloon and UI responsiveness to collapse.
The Solution: "Render Only the 30 Visible Rows—Store Raw History in a Fixed-Size POD Ring Buffer!"
We normalized each trade event into a compact ~40-byte fixed-size POD struct (CompactTradeRow) and built a VirtualGrid backed by an $O(1)$ chunked ring buffer capped at 64MB (StreamStore<CompactTradeRow>).
// 40-byte fixed-size POD struct representing a single trade event (Zero heap allocations!)
struct CompactTradeRow {
    char     code[8];       // Symbol code
    uint32_t timeHhmmss;    // Trade timestamp (HHMMSS integer)
    int64_t  price;         // Execution price
    int64_t  diff;          // Net change from previous close (signed)
    uint64_t tradeVolume;   // Single trade quantity
    uint64_t cumVolume;     // Cumulative volume (normalized in thousands)
    uint8_t  exchangeKind;  // Exchange kind (Primary / ATS / Index)
    uint8_t  signCode;      // Tick sign code (Upper Limit / Up / Flat / Down / Lower Limit)
};
3 Core Mechanisms of the Virtual Grid
- Zero Formatting at Ingestion Time ($O(1)$ Append):
Even when thousands of trades arrive per second,StreamStoresimply appends the 40-byteCompactTradeRowto the tail of a contiguous memory chunk. There are zero string conversions and zero per-row heap allocations. - On-Demand Viewport Formatting at Paint Time (
ReadCellfor ~30 Rows):
Even with 100,000 rows in history, a user's monitor only displays 25 to 35 rows at any moment. DuringWM_PAINT,ReadCell(row, col)is invoked exclusively for the visible viewport range ([firstVisibleRow, lastVisibleRow]) to format strings and colors on the fly. - Immediate Yield on User Input Detection (
InputPendingBudget Yield):
The ingestion loop draining trade events intoStreamStoreenforces a strict2,000us (2ms)time budget and checksGetQueueStatus(QS_INPUT)(mouse/keyboard activity), yielding control immediately whenever user input arrives. Consequently, while ingesting 514,918 trade packets during the market open burst,inputYieldstriggered 2,608 times—keeping scrolling and window dragging silky smooth.
3. Lock-Free Adaptive Frame Throttler (RefreshPolicy)
Under normal market conditions, screens should refresh smoothly every 30ms (~33fps). However, during a 1–2 second micro-burst at the opening bell when background queues surge, the UI refresh interval must dynamically back off (Backpressure) so CPU cores can prioritize packet ingestion.
We packed a 25-bit timestamp bucket (128ms resolution) and a 7-bit recommended interval (5ms resolution) into a single 32-bit atomic integer (std::atomic<uint32_t>), creating a lock-free adaptive throttler (RefreshPolicy) driven by a single CAS instruction:
class RefreshPolicy {
    static constexpr uint32_t TickMask = 0x01ffffff;
    mutable std::atomic<uint32_t> state_{0}; // [25-bit timestamp | 7-bit interval/5]

public:
    unsigned Recommend(uint32_t nowMs, size_t pendingTasks) const noexcept {
        // 1. Compute target refresh interval (ms) from pending queue depth
        const unsigned target =
            pendingTasks >= 120 ? 500 :
            pendingTasks >=  70 ? 300 :
            pendingTasks >=  35 ? 150 :
            pendingTasks >=  15 ?  60 : 30;

        const uint32_t tick = nowMs >> 7; // 128ms time bucket
        uint32_t old = state_.load(std::memory_order_relaxed);
        unsigned current = (old & 127) * 5;
        const uint32_t elapsed = (tick - (old >> 7)) & TickMask;
        const bool forward = elapsed != 0 && elapsed < (TickMask / 2);

        // 2. Fast Ramp-Up on load spikes; Smooth Decay (-25% per 128ms) as load subsides
        if (current == 0 || target > current) {
            current = target;
        } else if (forward && target < current) {
            const unsigned step = (current - target) / 4;
            current -= (step < 5 ? 5 : step);
            if (current < target) current = target;
            current = ((current + 4) / 5) * 5;
        } else if (!forward) {
            return current;
        }

        const uint32_t stamp = (forward || (old & 127) == 0) ? tick : (old >> 7);
        const uint32_t next = (stamp << 7) | (current / 5);
        state_.compare_exchange_strong(old, next, std::memory_order_relaxed);
        return current;
    }
};- Fast Ramp-Up / Smooth Decay: When queue buildup is detected, the refresh interval steps up immediately to protect the UI thread; once the burst passes, it decays smoothly back down to
30mswithout visual jitter.
Coming Up Next
After deploying this first wave of architectural changes, UI freezes vanished dramatically. Yet we didn't stop there—we inspected the market open profiler logs under a microscope and uncovered three unexpected hidden culprits:
- "Why did overall process CPU utilization rise from 0.9% to 1.8% even though UI freezes disappeared?" (Culprit: 423.5
WM_ENGINE_NOTIFYwindow messages per second!) - "Why does the unified OrderBook screen (
OrderBookView) occasionally spike to 31ms on a single tick?" (Culprit: ActiveXVSFlexGridper-cellput_CellCOM overhead!) - "Why does the 60-symbol Multi-Quote Matrix (
MultiQuoteMatrix) update its quotes only once every 1 second at market open?" (Culprit: a 4-slot coordinator limit combined with a self-inflictedpressurepenalty bug!)
In [Part 5], we share the deep-dive debugging and micro-optimization war stories that eliminated all three bottlenecks.